The Average Enterprise GPU Is Busy 5% of the Time. Price Your Cluster Accordingly.
Every rent-versus-build spreadsheet has the same missing number, and almost nobody measures it before signing. In 2026 the scarce input is power and memory, not GPUs.
The spreadsheet always wins the first meeting.
Someone takes the purchase price of eight GPUs, divides it by three years of hours, sets the result against a cloud provider’s on-demand rate, and arrives at a number that makes owning look obviously cheaper. Two dollars an hour against six. Nobody argues, because the arithmetic is correct.
The arithmetic is correct and the conclusion is usually wrong, because the denominator is fiction. Dividing by three years of hours assumes the GPU is busy for three years of hours.
Cast AI measured what that assumption is worth across tens of thousands of Kubernetes clusters on AWS, Azure and Google Cloud, and published the answer in April 2026: average GPU utilization of 5%.
Not 50%. Five.
By the end of this piece you will know why that figure moves the rent-versus-build line far enough that most teams are answering the wrong question, what a cluster really costs in 2026 once you price power instead of chips, why the GPU depreciation panic argues for and against ownership at once, and the five numbers that turn all of it into a decision.
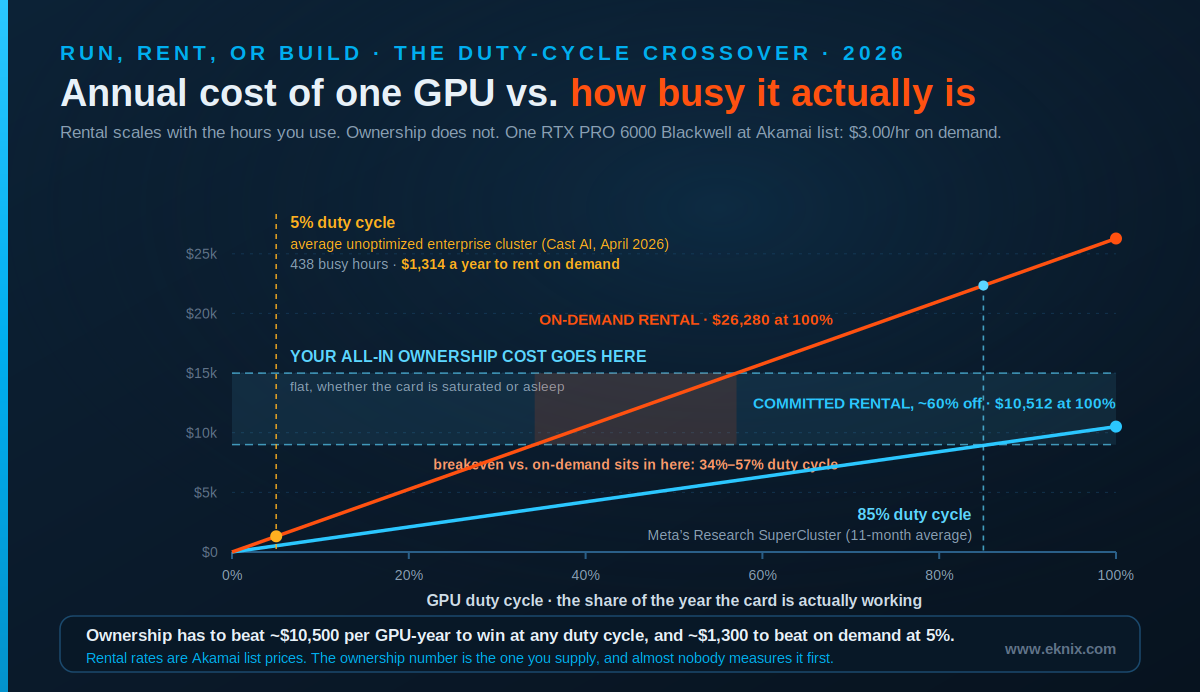
The short version: run, rent, or build is a duty-cycle question wearing a cost-per-hour costume. At 5% utilization a GPU is busy 438 hours a year, and renting a Blackwell-class card for exactly those hours costs about $1,314 at Akamai’s $3.00 list rate. Nothing you can own delivers that GPU for $1,300. Run the same card at 80% and on-demand rental costs roughly $21,000 a year, at which point ownership is a real conversation, but its true competitor is committed capacity rather than on-demand: at a 60% reserved discount a full year lands near $10,500 per GPU, so owning has to beat that all-in to win at any duty cycle. Then check whether you can build at all. Northern Virginia colocation vacancy is 0.3%, ComEd has quoted Chicago power delivery into 2032 or later, the median US interconnection request took over five years to reach commercial operation, and large DRAM orders are running past 40 weeks. Measure the duty cycle first. Everything else follows from it.
Four doors, not three
The question has three options in its usual framing. There are four, and the missing one fits the largest group of teams.
Run means you never touch a GPU. You call a managed endpoint or a hosted model API and pay per token. You carry no capacity risk, no refresh risk, and no control over what happens underneath.
Rent means you take GPU instances by the hour, on demand or on a reservation. You choose the model, the quantization and the serving stack, and you stop paying when you stop asking. On-demand is the most expensive rate per hour and the cheapest bill per year when your duty cycle is low, which is worth reading twice.
Dedicate means the capacity is contractually yours, on someone else’s hardware, in someone else’s building, operated with you. This is the door people leave out, and it is where the interesting 2026 deals sit. Akamai’s own example of the shape: a four-year, $200 million service agreement for a multi-thousand-GPU cluster of NVIDIA Blackwell RTX PRO 6000 Server Edition cards, with AI-optimized Ethernet and NVMe-over-Fabric storage, disclosed on the February earnings call and detailed the month after. Dedicated silicon, negotiated term, somebody else’s power contract.
Build means you own everything under the model: racks, power, cooling, fabric, storage, scheduler, and the people who keep it alive at 3 a.m. Maximum control, maximum capital exposure, and a power procurement problem that has quietly become the hardest part of the job.
If this reads like the build, buy, or partner argument we made about security, that is because it is the same argument with different hardware. Owning GPUs is not the same thing as having compute available when your users need it.
The number that decides it is your duty cycle
A year holds 8,760 hours. Rental cost scales with the hours you use; ownership cost does not. You pay for the hardware, the space, the power and the staff whether the card is saturated or asleep. So this was never rate against rate. It is a sloped line against a flat one, and the crossing point is a utilization percentage.
Put real numbers in. Akamai lists an RTX PRO 6000 Blackwell Server Edition GPU at $3.00 per hour, with egress overage at $0.005 per GB. At a 5% duty cycle that card is busy 438 hours a year, and renting it for exactly those hours costs $1,314. There is no ownership model on earth that delivers a Blackwell-class GPU for $1,300 a year.
Now run it at 80%. That is 7,008 busy hours, or $21,024 on demand, and ownership starts to look serious. Notice what it is actually up against, though, because this is where most build cases quietly cheat. At 80% you would not be paying on-demand rates. You would have committed. One-year reserved terms commonly run 5% to 38% below posted on-demand, and CoreWeave’s reserved tiers reach roughly 60% off. A full year of committed capacity for one GPU at that discount costs about $10,512.
Which gives you a test you can apply this week, before modeling anything else:
All-in ownership has to land under roughly $10,500 per GPU per year to beat committed rental at any duty cycle, and under roughly $1,300 to beat on-demand at the utilization most enterprises actually run.
All-in means everything. Hardware amortized over an honest life, the card’s share of rack space, power, cooling, fabric, storage, spares, and the loaded cost of the people operating it. If you want to build your own version of the model:
breakeven duty cycle = (annual all-in cost of owning one GPU) / (on-demand rate x 8,760)
Two caveats about the 5% figure, because it is carrying a lot of weight here and it deserves the scrutiny.
Scope first. Cast AI measured unoptimized clusters before any autoscaling or right-sizing, and it excluded clusters belonging to AI labs precisely because those run GPUs hard. The split by platform was 5% on EKS, 6% on GKE and 2% on AKS. That is a measurement of a particular population, not a law of nature, and a team already running a tuned scheduler with queueing and preemption is not in it.
Second, high utilization is demonstrably reachable. Meta’s published research on its Research SuperCluster reports 83% and 85% average cluster utilization across RSC-1 and RSC-2, over eleven months, four million jobs and more than 150 million A100 GPU-hours.
The distance between 5% and 85% is the whole decision. Meta gets to 85% because it funds a research infrastructure organization whose job is keeping that fleet fed. Fund that function and ownership economics open up. Skip it and you will buy Meta’s hardware while getting Cast AI’s utilization, which is the most expensive outcome on the menu.
One trend does move the line toward ownership. Training is bursty; inference is a duty cycle. Gartner’s August 2026 forecast puts AI-optimized infrastructure-as-a-service spending at $42.276 billion this year, up 96.4% from $21.529 billion in 2025 and heading for $66.143 billion in 2027. Inside 2026, inference accounts for $23.3 billion against training’s $19 billion, the first year inference outspends training, rising to 59% of the total in 2027. Deloitte puts inference at roughly two-thirds of all AI compute in 2026, up from about half in 2025 and a third in 2023. A workload that serves users around the clock is exactly the shape that earns owned or dedicated capacity, and more teams are moving into it.
What renting costs in 2026, and why no rate card will tell you
You need a rental rate before you can run the breakeven. This turns out to be harder than it sounds, and the difficulty is itself a finding.
Three credible trackers priced the same chip in mid-2026 and disagreed sharply. AIMultiple’s index put the median on-demand H100 at about $3.15 an hour in July. Silicon Data’s standardized neocloud index, which normalizes for machine specs, term length and geography, has sat near $2.53 per GPU-hour. A third aggregator, splitting medians by provider type in late August, showed H100 at roughly $4.19 on specialist GPU clouds against $7.89 on hyperscalers.
Same silicon, prices from $2.53 to $7.89 depending on who counts and whose list you read.
The hyperscaler premium is real and routinely overstated in whichever direction flatters the person quoting it. Compare hyperscaler list prices against the cheapest neocloud listing in a dataset and you get a 3x to 6x gap. Compare median to median for the same GPU and it drops nearer 1.9x. Both are true statements about different comparisons.
So do not price this off published rate cards. Get quotes for your GPU, your term, your region and your cluster size, from at least one hyperscaler, one specialist GPU cloud and one distributed provider, and expect a spread wider than any blog post predicts, this one included.
Then watch the lines that are not GPU-hours. Egress is the classic ambush. At $0.005 per GB, moving 100 TB a month costs about $500; at ten or twenty times that rate the same traffic becomes a second GPU bill. If your inference is chatty, or your retrieval pipeline pulls large context out of another provider’s storage, price the data movement before the compute.
And match the commitment to the workload rather than to the discount. Spot capacity runs roughly half of on-demand and suits anything that checkpoints cleanly. Committing to a year of capacity for a workload whose steady-state volume you cannot yet predict is how teams end up paying for idle reserved GPUs, which is ownership economics with none of the upside.
What building costs, and it is not the GPUs
Ask a team what a cluster costs and you get a chip number. Ask what it costs to power and site that cluster and the room usually goes quiet. That is a problem, because in 2026 the power is the expensive half and the slow half.
Start with space, using CBRE’s Global Data Center Trends 2026 from June. For a 250 to 500 kW requirement, Chicago asking rates ran $200 to $230 per kW per month, up 14.7% year over year. Northern Virginia ran $190 to $235, Frankfurt $235 to $265. Singapore topped the list around $403, with Tokyo at $280 and Sydney at $188.
Turn that into an annual figure. One 40 kW AI rack in Chicago colocation costs $96,000 to $110,400 a year in space and power before you buy a single GPU. The same rack in Singapore is roughly $193,000. Deloitte describes one inference-optimized rack product drawing 370 kW, nearly three times the density of the same supplier’s training version; at Chicago rates that single rack runs $888,000 to $1.02 million a year, and about $1.79 million in Singapore.
Assuming you can get the space. Northern Virginia vacancy was 0.3% in the first quarter of 2026, down from 0.8% a year earlier. Atlanta was 1%, Dallas 1.8%, Chicago 2.2%, with Dallas carrying a record 716.7 MW under construction that was already 88% preleased. CBRE also notes that most existing facilities were designed for 5 to 15 kW per rack, well short of the 40 kW and up that AI hardware needs, so “we already have space in our own data center” is usually a statement about floor area rather than about power and cooling.
If the plan is to secure new power, understand the clock you are on. CBRE reports ComEd quoting Chicago power delivery into 2032 or later, a West London substation upgrade unlikely before the early 2030s, and five-year power allocation lead times in Hong Kong. Lawrence Berkeley National Laboratory’s Queued Up: 2026 Edition counted roughly 1,312 GW of generation and 749 GW of storage sitting in US interconnection queues at the end of 2025, with a median duration from interconnection request to commercial operation of over five years for projects completed that year. The historical figure is the sobering one: of the capacity that requested interconnection between 2000 and 2020, only 13% had reached commercial operation by the end of 2025, and 75% was withdrawn.
The hardware has its own queue, and it is not the GPU die. Large DRAM orders have stretched beyond 40 weeks, and Micron executives told investors in June that chip supply stays constrained beyond 2027. Memory is the pinch point, and it lands on the same server bill of materials.
Then notice who you are bidding against. Combined 2026 capital expenditure guidance from Amazon, Microsoft, Alphabet and Meta sits somewhere in the $720 to $745 billion range. Every megawatt and every DRAM allocation you want is something four of the best-capitalized companies in history also want, and occasionally winning that auction is not a strategy.
None of which makes building wrong. It makes building a multi-year infrastructure program with a real estate and utilities workstream attached, which is a different animal from a hardware purchase and should be funded as one or not started.
The depreciation panic cuts both ways
There is a live argument about how long a GPU is worth owning, and it lands directly on your amortization period, which sets your annual cost, which sets your breakeven.
The bear case has filings behind it. Amazon shortened the useful life of a subset of its servers and networking equipment from six years to five, effective January 2025, citing “the increased pace of technology development, particularly in the areas of artificial intelligence and machine learning.” The change cut $298 million from third-quarter 2025 net income and $677 million across the first nine months. Michael Burry pushed much further in a November 2025 post, putting real economic life closer to two or three years and estimating around $176 billion of understated depreciation across the industry between 2026 and 2028. Treat that last number as one investor’s unaudited estimate, because that is what it is.
The bull case is more recent. Meta went the other way from Amazon, extending the estimated useful life of certain servers and network assets to five and a half years for fiscal 2025 and cutting roughly $2.9 billion from that year’s depreciation. NVIDIA’s CFO has noted that A100s sold six years earlier still run at full utilization. And in August 2026 CoreWeave’s CEO disclosed on the second-quarter call that the company had signed an A100 contract running into 2029, nine years after that chip launched, adding that “pricing for prior generation SKUs is at or above where it was years ago” and that H100s coming off contract were rebooked at 95% of their original price. Refurbished A100s were still changing hands between roughly $7,800 and $18,900 in April 2026.
Read those together and you get a conclusion that suits neither camp. GPUs are holding value better than the three-year panic suggests, which helps the case for owning, since a longer honest amortization lowers your annual cost and pulls the breakeven duty cycle down. The same evidence says rental prices for older generations are not collapsing in your favor either, so waiting for cheap H100s is a weaker plan than it looks.
The obsolescence risk worth losing sleep over is not the card failing. It is a competitor renting the next generation at a lower cost per token while you sit in year two of a five-year amortization on this one. NVIDIA said in January that Rubin is in full production with partner availability in the second half of 2026, claiming up to a 10x reduction in inference token cost and a 4x reduction in the GPUs needed to train mixture-of-experts models against Blackwell. Rubin Ultra is scheduled for the second half of 2027. A five-year ownership model has to survive that, and “our hardware still works” is not the same claim as “our cost per token is still competitive.”
A decision matrix by workload shape
There is no universal answer, but the pattern tracks two variables above all others: how much of the time your GPUs are busy, and how confidently you can predict that twelve months out. Scale matters less than people expect, and mostly through its effect on those two.
| Workload shape | Duty cycle | Predictability | Usually the best fit | Why |
|---|---|---|---|---|
| Experiments, fine-tuning, spiky batch | Under ~20% | Low | Run a managed endpoint, or rent on demand | You pay for busy hours only. Ownership’s flat cost has almost nothing to amortize against, and a 5% duty cycle makes cheap hardware expensive per useful hour. |
| Production inference, business hours, growing | ~20-50% | Improving | Rent, layering reservations under the floor as it firms up | Captures most of the committed discount with no power contract and no refresh liability. Reserve the base, burst on demand. |
| Production inference, around the clock, predictable | Above ~60% | High | Dedicate: contracted capacity, operated | The duty cycle earns dedicated economics, and someone else carries power procurement, refresh and 24/7 operations. The band the build-versus-rent framing usually skips. |
| Steady, large, genuinely differentiating | Above ~75% | High, multi-year | Build, if and only if you can secure power | Defensible when compute is the product and the demand is contracted. Fund it as a multi-year program, not a purchase order. |
| Regulated or sovereign data | Any | Any | Dedicate, or run regionally with contractual residency | Sovereignty is a question about placement and control, not ownership. Owning hardware in the wrong jurisdiction satisfies nothing. |
| Latency-bound at the user | Any | Any | Distributed inference near users | When the budget is milliseconds to first token, the constraint is distance rather than duty cycle. See our piece on inference at the edge. |
The message is the diagonal. Almost nobody should build except teams whose compute is the product and whose demand is contracted years out. Almost nobody should sit on pure on-demand once a real production floor has emerged, because that floor is the cheapest discount available anywhere. The large middle, where a genuine 24/7 inference workload exists but the appetite for a utilities workstream does not, is where dedicated capacity does its most honest work.
Worth noting for anyone tempted to justify a build on compliance grounds: Gartner’s strategic technology trends for 2026 include geopatriation, predicting that more than 75% of European and Middle Eastern enterprises will move workloads to sovereign or regional providers by 2030, up from under 5% in 2025. That makes placement a contractual question. It does not make ownership a requirement.
Red flags in each model
Whichever door you pick, there are signs you picked it badly.
Running managed endpoints. Watch for a per-token bill growing faster than the usage behind it, which usually means retries, runaway agent loops, or context you re-send on every call. The other tell is discovering you cannot answer a customer’s question about where inference physically happened, because you never had the option to control it.
Renting. Watch for a reserved commitment bought for the discount rather than the workload, idling at 3 a.m. while finance congratulates itself on the rate. And watch the bill for the moment the GPU line stops being the largest one. When egress, storage or inter-zone traffic overtakes compute, you have an architecture problem that a cheaper GPU will not fix.
Dedicating. The red flags cluster around the difference between an operator and a landlord. Watch for a provider who cannot name who will be on your account, who will not commit to a replacement path when a card fails, who quotes best effort instead of a contractual availability target, or whose term structure holds you on this hardware generation past the point where the next one is cheaper per token. Ask what happens at the refresh boundary, and get the answer in writing.
Building. Watch for a project plan that ends at “racked and powered.” No named operations rota, no scheduling and queueing strategy, no utilization target with an owner, no budget line for the year-three refresh: that is not a capability, that is the industry’s 5% utilization number bought at full price. The other red flag is a power plan resting on a utility timeline you never received in writing, which is how a cluster becomes a depreciating asset in a warehouse.
Five numbers that turn this into a decision
All five are obtainable inside a month, and together they replace the argument with arithmetic.
- Duty cycle, measured rather than assumed. GPU-busy hours over GPU-hours available, across at least 30 days, at the device level rather than from the scheduler’s view of allocation. Allocated is not busy. This number decides which row of the matrix you are in, and it is the one the spreadsheet in the first meeting silently guessed.
- Peak-to-median ratio. Your busiest hour divided by your typical one. A high ratio argues for a reserved floor with on-demand burst above it, because sizing owned capacity for peak means paying for peak all year.
- All-in cost per owned GPU-year. Hardware amortized over an honest life, plus the card’s share of rack, power, cooling, fabric, storage, spares and loaded operations headcount. Set it against roughly $10,500 for committed rental and $26,280 for a year of continuous on-demand at $3.00 an hour. Without this number you cannot make this decision, and no vendor can make it for you.
- Cost per million tokens, end to end. Not per GPU-hour. Include egress, storage, orchestration and the requests you retried. It is the only unit that survives a hardware generation change, and the one your CFO can compare year over year.
- Time to capacity, per door. Renting is days. Dedicated capacity is weeks to months. Building is a power question first, and if the honest answer is that you have no signed utility timeline, that is the finding.
So which door is yours?
The point of all this is not to land everyone on renting. Some teams genuinely should build, and the ones whose compute is their product do. Some should run managed endpoints and never think about a GPU again.
But far more teams than will admit it are holding a spreadsheet that compares a rental rate to an ownership rate while quietly assuming a duty cycle nobody measured. That assumption does more work in the model than every other input combined, and the published evidence says it is usually wrong by an order of magnitude in the direction that flatters buying.
So work it backward. Measure the duty cycle first. If it is low, rent, and spend what you saved on raising utilization, because a scheduler that lifts you from 5% to 40% is worth more than any procurement negotiation you will ever run. If it is high and predictable, price dedicated capacity before you price a build, and compare it against the all-in ownership number rather than against a chip price. If you still want to build after pricing power, memory lead times and a year-three refresh, build, and staff the operating model as seriously as the purchase order.
One disclosure, since it belongs here. We operate on Akamai, so we have a horse in this race. Akamai’s published claims include up to 2.5x lower latency and up to 86% lower inference cost against traditional hyperscaler infrastructure, and its own benchmark reports 1.63x the inference throughput of an H100 for the RTX PRO 6000 Blackwell. Those are vendor figures, measured by the vendor, with “up to” attached, and you should weigh them the way you weigh every number in this category, mine included: directionally useful, not audited. The distributed cloud platform we run suits inference that has to sit near users and does not suit frontier-scale training, and we will say so in the meeting.
Here is the question I would actually like answers to, because it is better telemetry than any vendor forecast: what is your measured GPU duty cycle, and did you know it before or after you signed?
If you want that arithmetic run against your own workload instead of an industry average, that is the work we do. We will instrument your duty cycle and peak-to-median ratio, model run against rent against dedicated against build using your real token volumes, and tell you which door fits, including when the answer is to stay exactly where you are. Talk to one of our architects, and we will start with the measurement, not the sales pitch.