The Hidden Cost of a Slow Checkout: A Performance Audit Framework
A repeatable framework to audit checkout performance, measure each step, and attach a currency figure to every slow second. Updated for the INP era and the arrival of agent-led checkout.
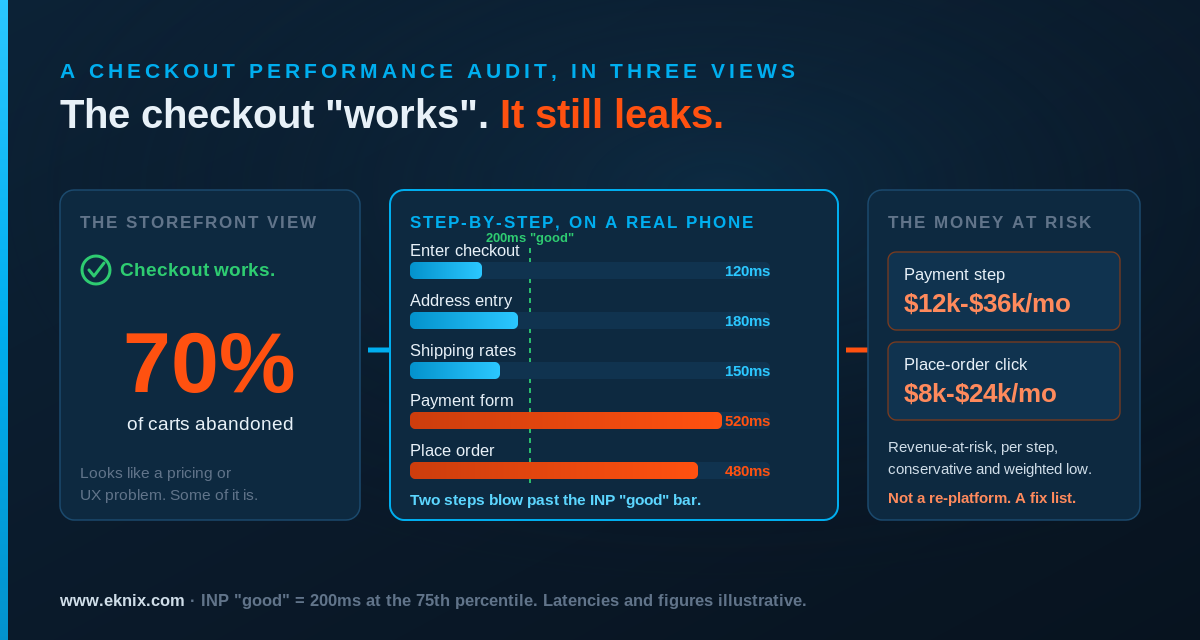
A slow checkout never shows up as an incident. The page loads. The card form accepts input. The order goes through. Synthetic monitoring is green, the status page is green, and the one flow in your entire estate that exists purely to take money is quietly leaking it, a few hundred milliseconds at a time, to nobody’s alarm.
That’s the trap. A broken checkout gets fixed within the hour because the revenue stops. A slow one survives for years because the revenue only softens, and a soft revenue line has a hundred plausible explanations that aren’t “our payment step takes four seconds on a mid-range Android.” Marketing blames the funnel. Merchandising blames the mix. Finance blames the market. Nobody blames the thing that’s actually doing it, because the checkout, by every test anyone runs on it, works.
We made the broad commercial case for speed in how page latency kills ecommerce revenue. This is the practical follow-up, and it’s deliberately narrower. Not the whole site: the checkout. Not “why speed matters”: a framework you can run yourself to find where your checkout is slow, what each slow step is worth in money, and which fixes to do first. By the end you should be able to walk into a planning meeting with a number instead of a feeling.
The short version: the checkout is the most expensive place on your site to be slow, because everyone there has already decided to buy. Audit it in four passes. First, map the funnel and measure each step as a real user experiences it, including interaction latency, not just page loads. Second, put a currency figure on each step using your own conversion data and a defensible range, not a headline multiplier. Third, hunt the checkout-specific killers: synchronous tax, shipping, fraud and payment calls on the critical path, third-party payment SDKs, redirect-based 3-D Secure, and bloated forms. Fourth, score it and split the findings into quick wins and structural fixes. In 2026 this matters more than it used to, because under INP every click in your checkout is now measured, and because a growing share of checkouts are being driven by software agents that abandon a slow page in milliseconds.
Why checkout is the most expensive place to be slow
Performance work usually starts at the top of the funnel, on the homepage and the product pages, because that’s where the traffic and the Core Web Vitals headlines are. That’s backwards for revenue. A slow product page loses you browsers, most of whom were never going to buy. A slow checkout loses you buyers, every one of whom had their card out.
The numbers around checkout are stark even before you add latency. The Baymard Institute, aggregating roughly fifty separate studies, puts the average documented cart abandonment rate at 70.22%. Some of that is unavoidable browsing behavior. A lot of it isn’t: 18% of shoppers have abandoned an order specifically because the checkout was “too long or complicated,” and the average checkout ships 23 form fields when 12 to 14 would do. Baymard estimates a large site can recover something like a 35% conversion uplift from checkout design alone.
Speed is woven through all of that. A long checkout that’s also slow doesn’t add friction, it multiplies it. Every additional step is another page that has to load, another set of scripts that has to execute, another interaction that has to respond. The friction a shopper feels is the sum of the steps and the latency of each one, and most teams have only ever measured the first half.
Here’s the part that makes it worth your time specifically: the customer at your payment step is the most valuable customer you will ever serve, because they’ve done all the work. They found you, they chose a product, they entered an address. The acquisition cost is already spent. Losing them to a spinning button is the single worst trade in your funnel, and it’s the one you can’t see in an aggregate conversion rate.
Pass 1: Map the funnel and measure each step
You can’t fix what you’ve averaged into a single number. The first job is to break the checkout into its real steps and measure each one as a transition, because the slowness is almost never spread evenly. It’s concentrated in one or two steps that you’ll only find by looking at them separately.
A typical checkout, however your platform labels it, comes down to five or six moments:
- Enter checkout: the hand-off from cart to the checkout shell.
- Contact and address: often where address autocomplete and validation fire.
- Shipping: frequently a synchronous call to a rates engine or carrier API.
- Payment: the heaviest step, where third-party SDKs, iframes, tokenization and fraud checks live.
- Review and place order: the click that matters most, and the one most likely to be blocked by analytics and tag firing.
- Confirmation: usually fast, but worth confirming it isn’t doing synchronous post-purchase work in the user’s path.
For each transition you want two things, not one. The first is the load cost: how long the next step takes to become usable. The second, and the one most audits miss, is the interaction cost: how long the page takes to respond when the shopper actually clicks “Continue,” “Apply code,” or “Place order.” Since March 2024, that second number has a name and a Core Web Vitals threshold. Interaction to Next Paint replaced First Input Delay as a Core Web Vital, and unlike the old metric it measures every interaction across the visit, not just the first, with a “good” bar of 200 milliseconds at the 75th percentile. Checkout is wall-to-wall interactions, which is exactly why INP is the metric that exposes a slow checkout when load-time tools say everything is fine.
Three sources of measurement, in order of how much you should trust them:
- Field data, segmented to the checkout path. This is the honest version. Pull Core Web Vitals from the Chrome User Experience Report or your own real-user monitoring, filtered to
/checkoutand its sub-steps, split by device. Real-user monitoring is the only way to see what your actual customers on their actual phones experience, which is the case we made in our piece on RUM. If your RUM can attribute INP to a specific element, you’ll often find a single button is responsible for most of the damage. - Lab data, on a throttled mobile profile. Run WebPageTest or Lighthouse against each step on a mid-range device profile with CPU throttling, not your developer laptop on office wifi. The gap between the two is where most “but it’s fast for me” arguments go to die.
- A stopwatch on a real phone. Unglamorous and indispensable. Put a three-year-old Android on a throttled connection and buy something. The steps that annoy you are the steps annoying everyone.
Write down a number for every step before you touch anything. The audit lives or dies on having that baseline.
Pass 2: Put a currency figure on each step
This is the pass that changes the conversation, and it’s the one where it’s easiest to lose credibility by overreaching. The goal is a defensible revenue figure for each slow step, presented as a range, built from your own data and a sensible relationship from the research. Not a single dramatic multiplier.
The research gives you the relationship, with caveats. Google’s “Need for Mobile Speed” work found that 53% of mobile users abandon a site that takes longer than three seconds to load. The Google-commissioned Milliseconds Make Millions study, run with Deloitte across 37 brand sites and more than 30 million sessions, found that a 0.1-second improvement in load time lifted retail conversion by 8.4% and travel conversion by 10.1%, and, the figure that matters most here, lifted travel checkout completion by 2.2%. Walmart famously found that every one-second improvement increased conversions by about 2%. The Amazon “100 milliseconds costs 1% of sales” line from 2006 is the granddaddy of all of these, and it comes with a health warning the others share.
That warning is the whole discipline of this pass. Those relationships were measured across small deltas. They do not extrapolate linearly to multi-second improvements. A page that’s four seconds slower than it should be will not recover “40%” of conversion just because someone multiplied 100 milliseconds by forty. The curve flattens hard at the fast end, and our own platform reading of Shopify’s 2026 study, which put conversion roughly 3.5% lower per 100 milliseconds of slower Largest Contentful Paint, comes with the same correlational caveat from Shopify itself.
So here’s a model you can actually defend:
- Take the revenue that flows through each step: sessions reaching that step, multiplied by the step’s current conversion-through rate, multiplied by average order value.
- Estimate the realistic latency you can remove from that step, from Pass 1.
- Apply a conservative sensitivity: somewhere between 0.5% and 2% conversion uplift per 100 milliseconds removed, and present the result as a range, weighted toward the bottom.
- Discount aggressively for the fact that real-world uplift is almost always less than the math suggests.
A worked example, kept deliberately modest. Say your payment step sees 2 million dollars of attempted orders a month and currently takes 1.2 seconds longer to respond than it should because of a synchronous fraud call and three payment scripts. Removing 800 milliseconds of that, at a conservative 0.5-1.5% per 100 milliseconds, models to roughly a 4-12% improvement in step completion. Even discounted hard to the low end, that’s a five-figure monthly number against what is usually a configuration-and-sequencing fix, not a re-platform. Presented as a dollar range weighted toward the bottom of the band, it survives contact with a skeptical CFO. Presented as a single triumphant percentage, it doesn’t, and it shouldn’t.
The discipline of building it per step, rather than for the checkout as a whole, is what makes it actionable. A single number tells you the checkout is slow. A number per step tells you the payment step is slow and the shipping step is fine, which is the difference between a roadmap and a complaint.
Pass 3: Find the checkout-specific performance killers
General performance advice covers images, caching and bundle size, and that all applies; we won’t repeat it when the latency post and the CDN configuration field guide already do. Checkout has its own distinct failure modes, and they cluster around one anti-pattern: doing slow work synchronously, on the critical path, while the shopper waits.
Synchronous third-party calls on the critical path
The checkout is where your application talks to the most external systems in the shortest window: a tax engine, a shipping-rates API, a fraud or risk score, an address validator, a payment gateway, sometimes a loyalty or promotions service. Each is a separate company’s latency, on a separate network, and the default way these get wired in is synchronously and in sequence: ask for tax, wait, ask for shipping, wait, ask for a fraud score, wait. The shopper experiences the sum of every third party’s slow day at once.
The fix is sequencing, not heroics. Calls that don’t depend on each other should run in parallel, not in series. Work that doesn’t have to block the next screen, such as a fraud score that can resolve in the background before “place order,” shouldn’t block it. Anything you can pre-warm while the shopper is still typing their address, you pre-warm. None of this requires the third party to get faster. It requires you to stop waiting for them one at a time.
Client-side payment SDKs and iframes
Modern payment integrations lean on client-side SDKs and hosted fields or iframes, for good PCI reasons. The cost is that the payment step often can’t render until a third-party script has downloaded, parsed and initialized, and that script is on someone else’s CDN having its own kind of day. Load it with intent: preconnect to the payment domain early, load the SDK ahead of the moment it’s needed rather than on arrival at the payment step, and make sure a slow gateway script degrades into a usable form instead of a blank rectangle with a spinner.
Redirect-based 3-D Secure and the handoff tax
Card authentication under PSD2 and 3-D Secure 2 frequently bounces the shopper out to an issuer’s domain and back. That round trip is latency you don’t own and can’t cache, and a slow issuer page reads to the customer as your checkout hanging. You can’t make the bank faster, but you can stop compounding it: keep your own pre- and post-redirect pages featherweight, avoid re-initializing your entire app on the return, and make sure the “verifying your payment” state is honest and immediate rather than a frozen button.
The “place order” click, in the INP era
This is the most important interaction in commerce and, in 2026, the most exposed. Under the old First Input Delay metric, work that fired in response to a click was effectively invisible to Core Web Vitals. Under INP, it isn’t. When a shopper clicks “Place order” and your code synchronously fires a conversion pixel, an analytics purchase event, a tag-manager payload and a session-recording hook before it gets on with charging the card, all of that delay now lands on your INP score and is felt as a stutter at the worst possible moment. Defer the telemetry. Charge the card, confirm the order, then fire the tracking. The marketing events will still arrive; they just shouldn’t sit between the customer and their receipt.
Forms that are heavier than they look
Every field is markup, often a validation script, sometimes a third-party autocomplete that phones home on each keystroke. The 23-field average Baymard documents isn’t only a UX problem; it’s a performance one, because each field is something to render, hydrate and respond to. Cutting to the 12-14 fields that actually matter speeds the step up as well as shortening it. Address autocomplete in particular deserves scrutiny: a debounce that’s too aggressive turns every character into a network request and a re-render, which is precisely the kind of thing INP now scores.
Pass 4: Score it
An audit that ends in a pile of observations gets read once and forgotten. An audit that ends in a score gets re-run next quarter and argued over in planning, which is the point. Grade each checkout step against the thresholds that actually predict conversion, and keep the rubric brutally simple so anyone can apply it.
| Step | Metric | Good (1pt) | Needs work (0.5pt) | Failing (0pt) |
|---|---|---|---|---|
| Enter checkout | LCP of checkout shell | ≤ 2.5s | 2.5-4s | > 4s |
| Contact / address | INP on field interaction | ≤ 200ms | 200-500ms | > 500ms |
| Shipping | Time to rates displayed | ≤ 1s | 1-3s | > 3s |
| Payment | Time to payment form usable | ≤ 2s | 2-4s | > 4s |
| Place order | INP on the order click | ≤ 200ms | 200-500ms | > 500ms |
| Whole flow | Mobile field CWV pass | All 3 pass | 1 fails | 2+ fail |
Add the points and read the total honestly: 5-6 is a checkout that’s helping you, 3-4.5 is leaking money you can recover quickly, below 3 is a checkout that’s actively undermining your acquisition spend. The thresholds aren’t arbitrary; 2.5 seconds for LCP and 200 milliseconds for INP are Google’s own “good” boundaries, and they’re worth taking seriously given that, on DebugBear’s 2026 reading of CrUX data, only about half of mobile sites pass all three Core Web Vitals, and INP is now the most commonly failed of the three. A checkout that passes this scorecard is already ahead of most of the web.
The reason to keep the rubric this plain is that it travels. A scorecard a product manager can fill in is a scorecard that gets filled in. One that needs a performance engineer to interpret gets run exactly once, by the performance engineer, and then it dies.
Quick wins versus structural fixes
Once you’ve scored it, sort the findings by effort, because the two categories get funded differently and you want the cheap wins shipping while the bigger work goes through planning.
The quick wins, broadly a sprint or less and mostly configuration: defer the analytics and pixel firing on the “place order” click; preconnect and pre-load the payment SDK; cut the form to its essential fields; parallelize the third-party calls that are currently in series; fix the address-autocomplete debounce; make sure the checkout shell’s static assets are actually cached at the edge with the right headers, which is its own quiet topic in the CDN configuration guide.
The structural fixes, a quarter or a roadmap item: moving fraud and risk scoring off the synchronous path; replacing a chatty rates integration with a cached or pre-computed shipping estimate; rebuilding a payment step that hard-depends on a slow SDK to render; edge-side personalization and prefetching of the next checkout step, the kind of work Akamai EdgeWorkers exists to do. These cost more, but they’re also where the multi-second wins usually hide.
The sequencing matters as much as the list. Ship the quick wins first, re-measure, and let the recovered revenue from the cheap fixes fund the structural ones. An audit that demands a re-platform before it shows any return rarely gets the re-platform. An audit that pays for itself in a sprint earns the right to ask for the quarter.
The 2026 shift: when the buyer isn’t a person
There’s a reason to run this audit now rather than next year, and it’s not only that INP made every checkout click measurable. It’s that a growing share of checkouts are about to stop being driven by humans at all.
The first half of 2026 was when agent-led checkout moved from demo to infrastructure. Visa shipped Intelligent Commerce and a connector for accepting agent-initiated payments across protocols; Mastercard launched Agent Pay with tokens scoped to a specific agent and merchant; Stripe and OpenAI published the Agentic Commerce Protocol; Google announced a Universal Commerce Protocol with Shopify, Target, Walmart and others. McKinsey and the ICSC have put numbers on where this goes, projecting agentic channels into the trillions of dollars globally by the end of the decade. We worked through what this means for your front door in when your next customer is an AI agent.
The performance implication is sharp and specific. A human will tolerate a slow checkout, grudgingly, because they’ve already invested effort and a spinner triggers sunk-cost patience. An agent has no sunk-cost instinct and no patience to trigger. It is parsing your structured data and your APIs on a timeout, and when your payment step takes four seconds because of a synchronous fraud call and three scripts, the agent doesn’t wait and sigh. It abandons and completes the purchase at a competitor whose checkout answered in time. The slow checkout that costs you a fraction of human buyers today will, as this share grows, simply fail to transact for the machine buyers of next year. The work in this audit is the same work that makes you legible to them.
Run the audit
None of these four passes needs a tool you don’t already have, and the whole thing fits in an afternoon for a single checkout. Map the steps, measure each one as a real customer on a real phone experiences it, attach a conservative and defensible revenue figure to the slow ones, hunt the checkout-specific killers, score it, and split the findings into what you can ship this sprint and what belongs on the roadmap. The output is a prioritized list with a number next to each line, which is the only form of performance argument that reliably moves budget.