Do You Know How Your Customers Experience Your Site? Or Just Where They Go?
Behavioural analytics and real user monitoring answer different questions. Most teams only have one.
Most engineering teams I talk to have Google Analytics. A lot of them assume that means they understand how their site is performing. It doesn’t.
Google Analytics is an excellent tool for answering one set of questions: where do users come from, where do they go, what do they convert on, where do they drop off? It’s a behavioural map. It tells you the path. What it doesn’t tell you is what the path felt like — how long it took, how it degraded under load, which users are bouncing not because the content is wrong but because the page took five seconds to load on a 4G connection in Germany.
That’s a different instrument for a different question. And the gap between the two is often where performance problems hide.
What real user monitoring actually measures
Akamai mPulse is a Real User Monitoring (RUM) platform. Every page load from every real visitor generates a performance beacon — a timestamped measurement of exactly what happened during that session: DNS resolution time, TCP connection establishment, TLS handshake duration, time to first byte, front-end rendering time, and full page load. Aggregated across thousands of sessions, this gives you a statistically sound picture of what your users are actually experiencing right now.
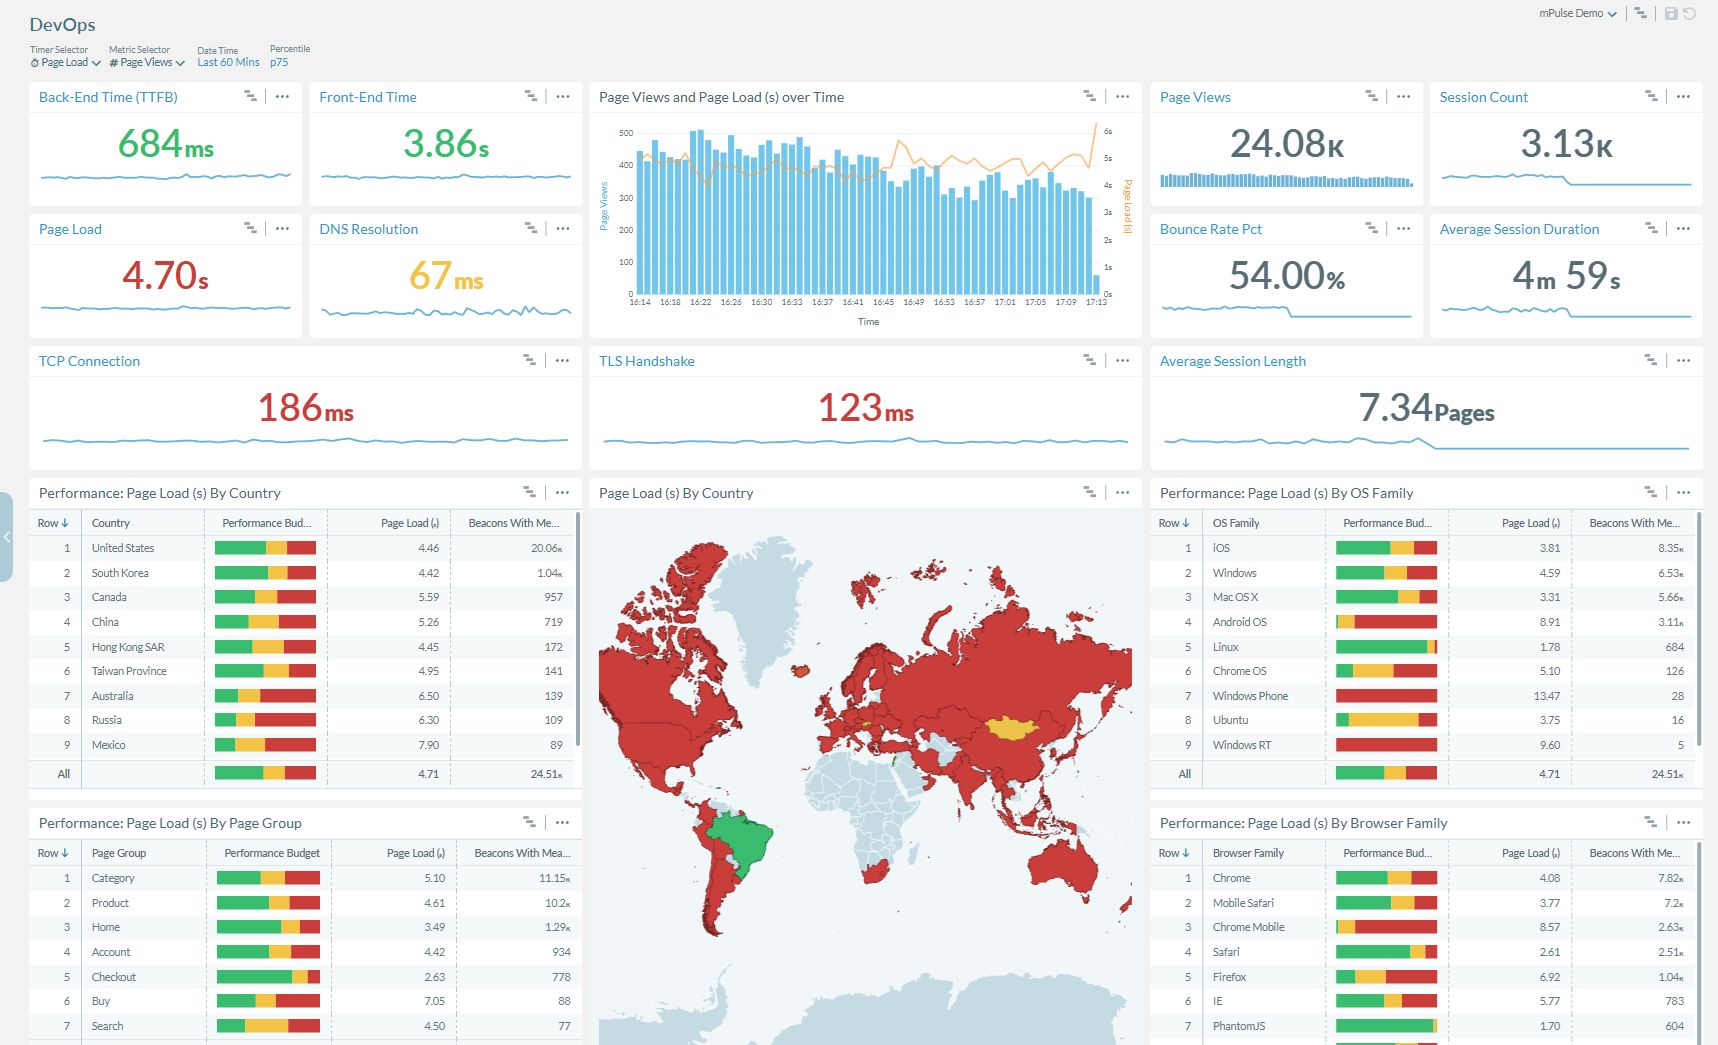
The dashboard above shows a typical mPulse DevOps view at p75 — the 75th percentile, meaning three in four users experienced this or better. Back-end time (TTFB) at 684ms. Front-end time at 3.86s. Full page load at 4.70s. DNS resolution at 67ms. TCP at 186ms. TLS at 123ms.
Those numbers mean something specific: TCP and TLS combined at 309ms is nearly half the total back-end time. That’s infrastructure overhead, not application logic. A team working from Google Analytics alone would have no visibility into this at all — they’d see bounce rate, session duration, and maybe a Core Web Vitals summary from Search Console. They wouldn’t see the network-layer timing that’s costing them half a second per session.
The dimensions that make the data actionable
Raw averages hide problems. mPulse segments performance across the dimensions that actually matter:
By geography: The same p75 page load that’s 3.49s for your Home page in the US might be 7.90s in Mexico and 6.50s in Australia. This isn’t a code problem — it’s an infrastructure problem. A user in Sydney hitting an origin in Amsterdam gets physics-constrained latency before a single line of application code runs. Geo-segmented RUM makes this visible; Google Analytics’ session data does not.
By OS and device: iOS users in the example above see 3.81s page load. Android users see 8.91s. That’s a 2.3x performance gap on the same content, same CDN. It points to rendering path differences — JavaScript execution budget, image format support, resource prioritisation — that only show up when you’re measuring what real devices do, not what your test environment does.
By page group: Checkout at 2.63s. Category pages at 5.10s. Buy flow at 7.05s. If you’re allocating engineering effort to improve performance, this is the map. Optimising your Home page for a retailer is rarely the highest-leverage decision; optimising the Buy flow almost always is. Without this segmentation, teams tend to work on what’s visible, not what matters.
By browser family: Chrome at 4.08s. Safari at 2.61s. IE at 5.77s. Firefox at 6.92s. Browser-specific performance gaps point to JavaScript compatibility issues, CSS rendering differences, or network protocol support (HTTP/2 push, preconnect hints) that behave differently across engines.
What-if analysis before you commit
One capability that’s underused: mPulse’s what-if analysis lets you model the revenue impact of a performance change before implementing it. You set a performance budget — say, reduce p75 page load by 800ms on Category pages — and the platform estimates the conversion impact based on your actual traffic and the measured correlation between load time and bounce rate in your own data.
This turns a performance conversation from “our pages could be faster” to “reducing Category page load time by 800ms is worth approximately X in incremental revenue per month.” That’s a different conversation with a product team or a CFO.
How it compares to Google Analytics
The two tools aren’t in competition — they answer orthogonal questions.
| Google Analytics | Akamai mPulse | |
|---|---|---|
| Primary question | Where did users go? | How did it perform? |
| Data source | Page view events | Per-session performance beacons |
| Network timing | No | Yes (DNS, TCP, TLS, TTFB) |
| Real-device breakdown | Basic | Detailed (OS, browser, connection type) |
| Geographic performance | Traffic volume | Latency by geography |
| Performance budgets | No | Yes, with revenue correlation |
| What-if analysis | No | Yes |
Teams that run both get a complete picture: Google Analytics tells you what users did; mPulse tells you what they experienced while doing it. The combination makes it possible to distinguish “users abandoned checkout because of UX” from “users abandoned checkout because it took eleven seconds to load on mobile.”
Where to focus
If you’re running a platform where performance has a direct revenue relationship — e-commerce, SaaS, fintech, travel — RUM is not optional. You’re making optimisation decisions constantly, and without knowing which pages are slow for which users on which devices, you’re optimising based on your developers’ broadband connections and your CI test environment’s hardware. Neither reflects your actual user base.
The goal isn’t faster average performance. It’s understanding the distribution: how many users are experiencing sub-2s loads, and how many are experiencing 8s loads, and which segment is larger in your highest-value page groups.